
Software development lab
CRISPRCasTyper
CRISPRCasTyper is a new automated software with improved capabilities for identifying and typing CRISPR arrays and cas loci across prokaryotic sequences, based on the latest classification and nomenclature (44 subtypes/variants). Besides subtyping CRISPR-Cas loci we also implemented a novel feature which subtypes CRISPR arrays based on the sequence composition of the direct repeats. This allows the typing of orphan and distant CRISPR arrays which, for example, are commonly observed in fragmented metagenomic assemblies.

Furthermore, the tool provides a graphical output, where CRISPRs and cas operon arrangements are visualized in the form of colored gene maps. This can aid in annotation of partial and novel systems through synteny, and also a simple way to check what genes are flanking the CRISPR-Cas loci.
You can find the standalone tool at GitHub: https://github.com/Russel88/CRISPRCasTyper, and we also made an easy-to-use web server: https://cctyper.crispr.dk
Check out our preprint for all the features and for a benchmark showing the high accuracy of CRISPRCasTyper: https://doi.org/10.1101/2020.05.15.097824
DAtest - differential abundance analysis
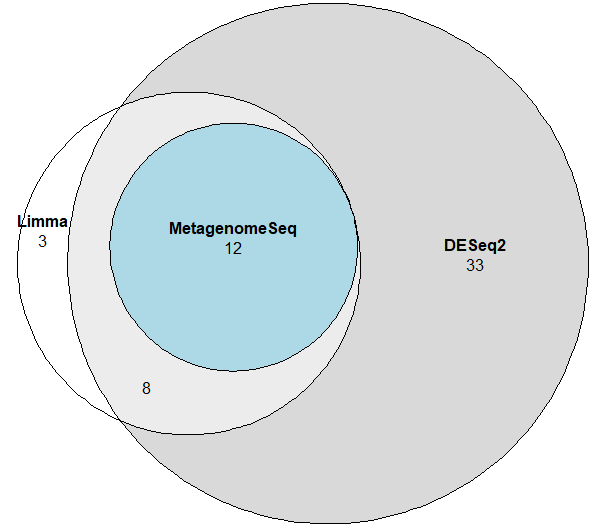
DAtest is an R package made for aiding researchers in choosing a differential abundance method. There are a plethora of methods for conducting differential abundance analysis, but no gold standard. DAtest uses a permutation and spike-in technique to evaluate the sensitivity and specificity of the different methods on your own dataset. Furthermore, we made it simple to run multiple methods and compare their output, thereby making it easy to assess the robustness of the results.
You can find the Wiki at GitHub: https://github.com/Russel88/DAtest/wiki, and we also have a short preprint on the methodology: https://www.biorxiv.org/content/10.1101/241802v1
RCon3D - quantitative 3D analyses of confocal microscopy images
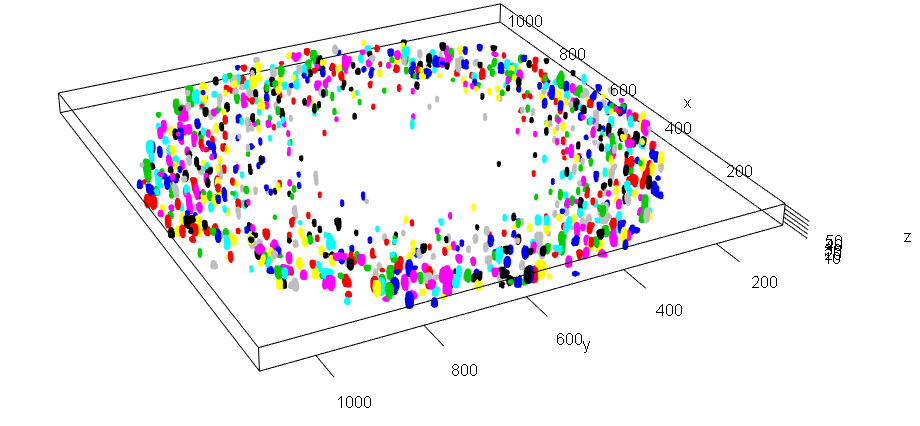
3D plot of microbial aggregates with a scale in microns
RCon3D is an R package for high-throughput quantitative 3D analyses of confocal microscopy images of microbial biofilms, microcolonies and communities. With RCon3D you can do co-aggregation analyses (how likely are two strains to aggregate together), occupancy analysis (what is occupying the space around a specific strain), finding and quantifying aggregates, dynamic sectioning (split in top and bottom biofilm based on biomass), and much more.
The package is available at GitHub: https://github.com/Russel88/RCon3D, and has been used in several papers, such as:
Amplicon data analysis
We have a full tutorial for analysing amplicon sequencing data all the way from raw data to figures and statistics. It is tailored for students and researchers who are new to the R programming language and to statistical analysis. We have tried to make it comprehensive including both background material, links to in-depth material, and of course snippets of R code to conduct the analyses. We use it in our course The Human Microbiome - The Experiment, and we made it public as other students or researchers might find it useful.
The tutorial is available at: https://microucph.github.io/amplicon_data_analysis/
Section of Microbiology
![]()
Contact
 Postdoc
Jakob Russel
Universitetsparken 15
Building 1, 1st floor
DK-2100 Copenhagen
Email: jakob.russel@bio.ku.dk
The RCon3D package used in papers
 Liu et al. (2017) Low-abundant species facilitates specific spatial organisation that promotes multispecies biofilm formation.
  Røder et al. (2018) Enhanced bacterial mutualism through an evolved biofilm phenotype.
ISMEJ